Overview

Decorators provide the simplest way to add comprehensive tracing to your LLM workflows without modifying your existing code structure. By adding @workflow and @task decorators to your functions and classes, you can automatically capture detailed execution traces that show the complete hierarchy of your LLM operations.
Traces example showing workflow and task hierarchy

Compatibility

IntegrationSupportNotes
Keywords AI NativeBuilt-in tracing with Keywords AI SDK
OpenAI SDKPython only
Vercel AI SDKNot currently supported

Integration

Setup

Make sure if have everything ready before you start.

Implementation

Annotate your workflows

Use the @workflow and @task decorators to instrument your code:
from keywordsai_tracing.decorators import workflow, task
from keywordsai_tracing.main import KeywordsAITelemetry

k_tl = KeywordsAITelemetry()

@workflow(name="my_workflow")
def my_workflow():
    @task(name="my_task")
    def my_task():
        # Your task logic here
        pass
    my_task()

Full example with LLM calls

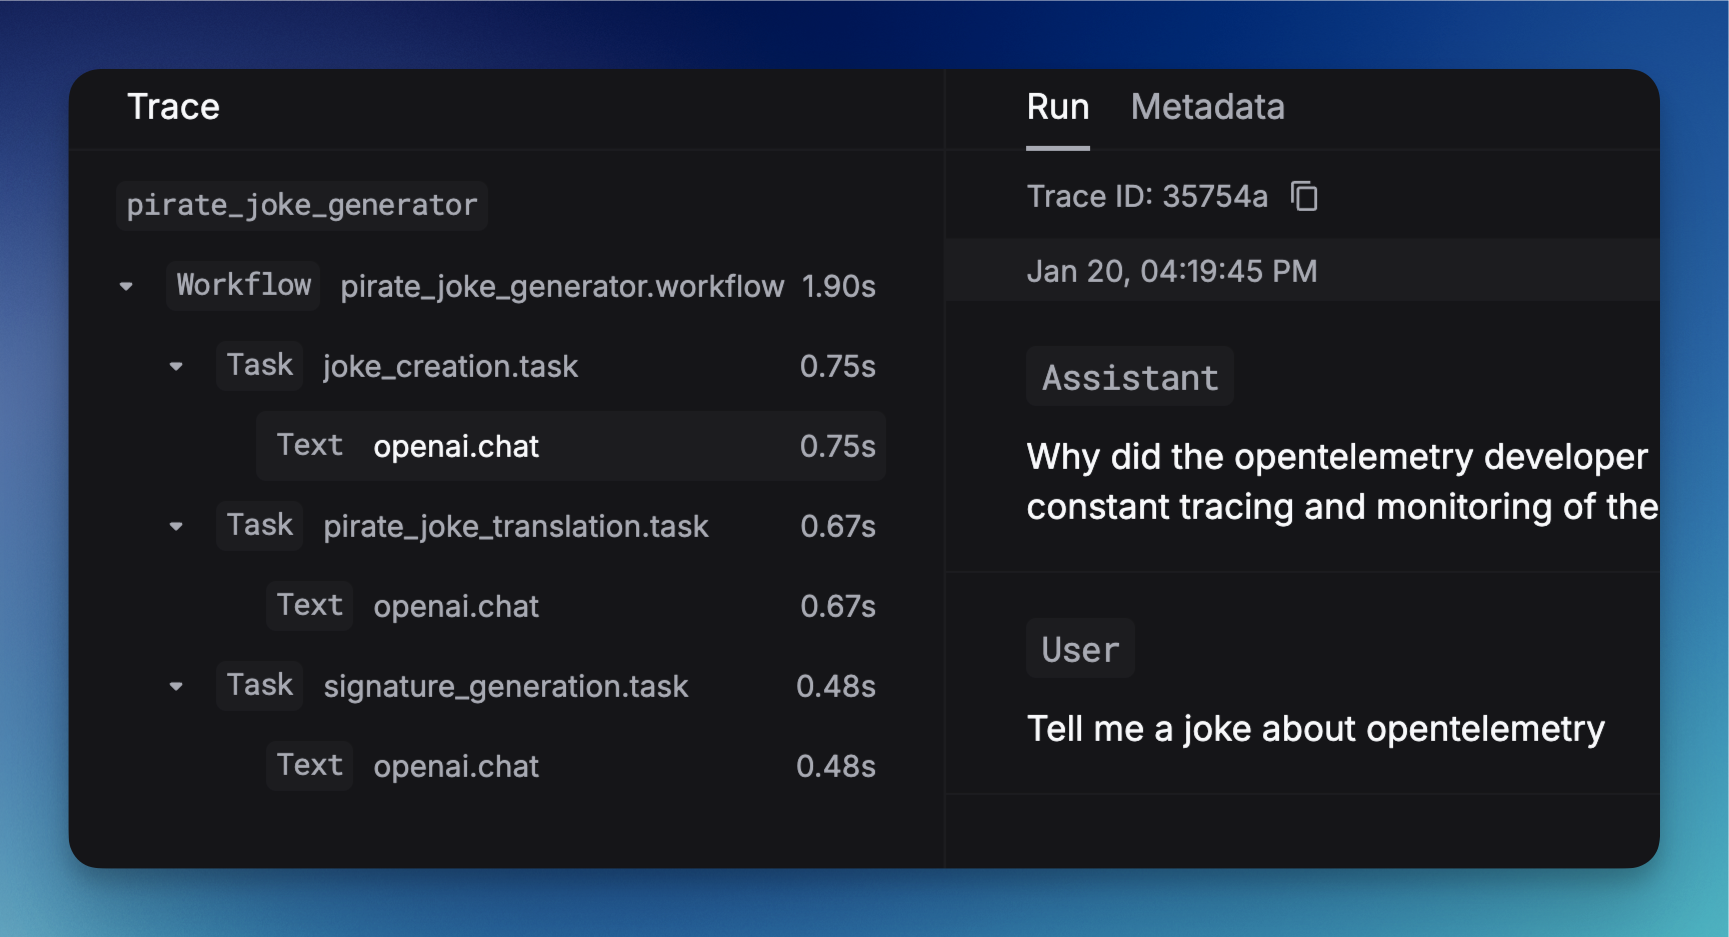
This example demonstrates a complete LLM workflow with three sequential tasks:
  1. Joke Creation (joke_creation): Generates an original joke about OpenTelemetry using GPT-3.5-turbo
  2. Pirate Translation (pirate_joke_translation): Transforms the joke into pirate language
  3. Signature Generation (signature_generation): Adds a creative signature to the final pirate joke
The @workflow decorator wraps the entire process, while each @task decorator instruments individual LLM operations.
from openai import OpenAI
from keywordsai_tracing.decorators import workflow, task
from keywordsai_tracing.main import KeywordsAITelemetry

k_tl = KeywordsAITelemetry()
client = OpenAI()

@task(name="joke_creation")
def create_joke():
    completion = client.chat.completions.create(
        model="gpt-3.5-turbo",
        messages=[{"role": "user", "content": "Tell me a joke about opentelemetry"}],
        temperature=0.5,
        max_tokens=100,
        frequency_penalty=0.5,
        presence_penalty=0.5,
        stop=["\n"],
        logprobs=True,
    )
    return completion.choices[0].message.content

@task(name="signature_generation")
def generate_signature(joke: str):
    completion = client.chat.completions.create(
        model="gpt-3.5-turbo",
        messages=[
            {"role": "user", "content": "add a signature to the joke:\n\n" + joke}
        ],
    )
    return completion.choices[0].message.content

@task(name="pirate_joke_translation")
def translate_joke_to_pirate(joke: str):
    completion = client.chat.completions.create(
        model="gpt-3.5-turbo",
        messages=[
            {
                "role": "user",
                "content": "translate the joke to pirate language:\n\n" + joke,
            }
        ],
    )
    return completion.choices[0].message.content

@workflow(name="joke_workflow")
def joke_workflow():
    joke = create_joke()
    pirate_joke = translate_joke_to_pirate(joke)
    signature = generate_signature(pirate_joke)
    return signature

# Run the workflow
result = joke_workflow()
print(result)

Decorate classes for object-oriented workflows:

from openai import OpenAI
from keywordsai_tracing import KeywordsAITelemetry
from keywordsai_tracing.decorators import workflow, task

k_tl = KeywordsAITelemetry()
client = OpenAI()

@workflow(name="joke_agent", method_name="run")
class JokeAgent:
    @task(name="joke_creation")
    def create_joke(self):
        completion = client.chat.completions.create(
            model="gpt-3.5-turbo",
            messages=[{"role": "user", "content": "Tell me a joke about opentelemetry"}],
        )
        joke = completion.choices[0].message.content
        return joke
    
    def run(self):
        return self.create_joke()

# Usage
agent = JokeAgent()
result = agent.run()

How to see this in the platform

Once you’ve implemented decorators in your code and executed your workflows, you can view the traces in the Keywords AI platform:

Accessing traces

  1. Navigate to the Traces page in your Keywords AI dashboard
  2. You’ll see a list of all your traced workflows and tasks

Understanding the trace view

  • Workflow overview: See the complete execution flow of your decorated workflows
  • Task breakdown: View individual tasks within each workflow, including execution time and status
  • LLM call details: Inspect the actual requests and responses for each LLM operation
  • Performance metrics: Analyze latency, token usage, and costs for each operation
  • Error tracking: Identify and debug failures in your workflows

Example trace visualization

Traces example showing workflow and task hierarchy
The trace view shows:
  • The parent workflow (e.g., joke_workflow, vercel_ai_workflow, openai_workflow)
  • Individual tasks (e.g., joke_creation, generate_text, researcher_agent)
  • Execution timeline and dependencies
  • LLM call metadata and performance metrics