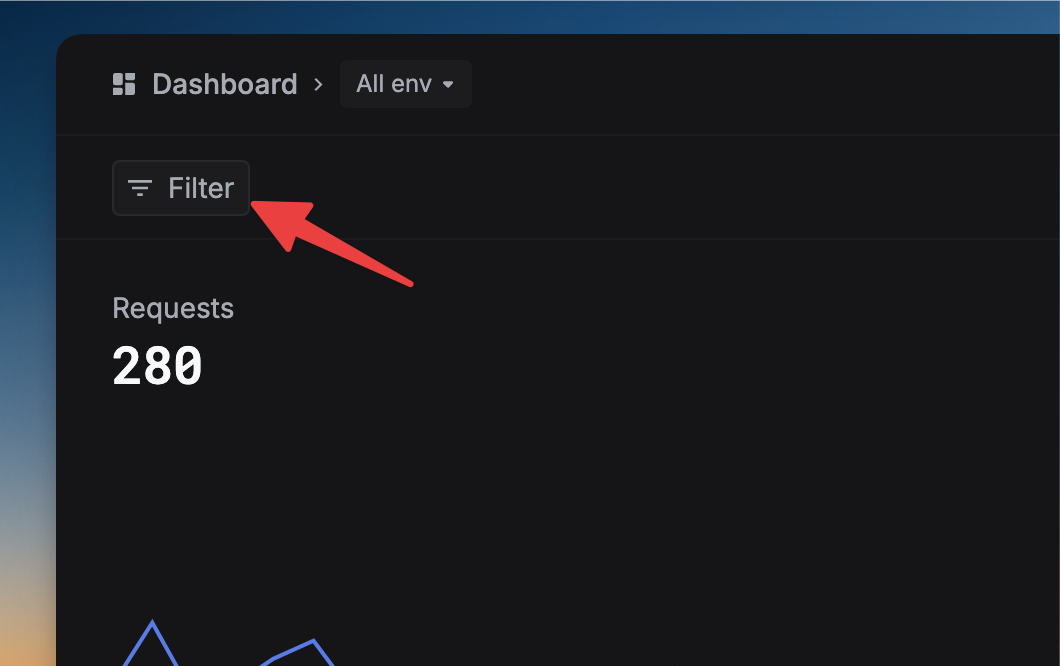
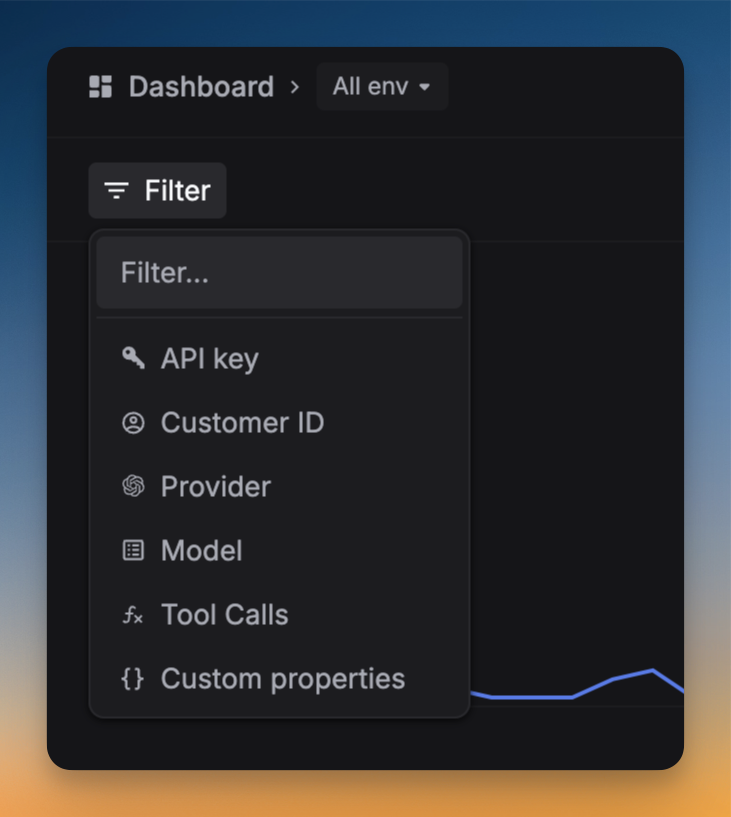
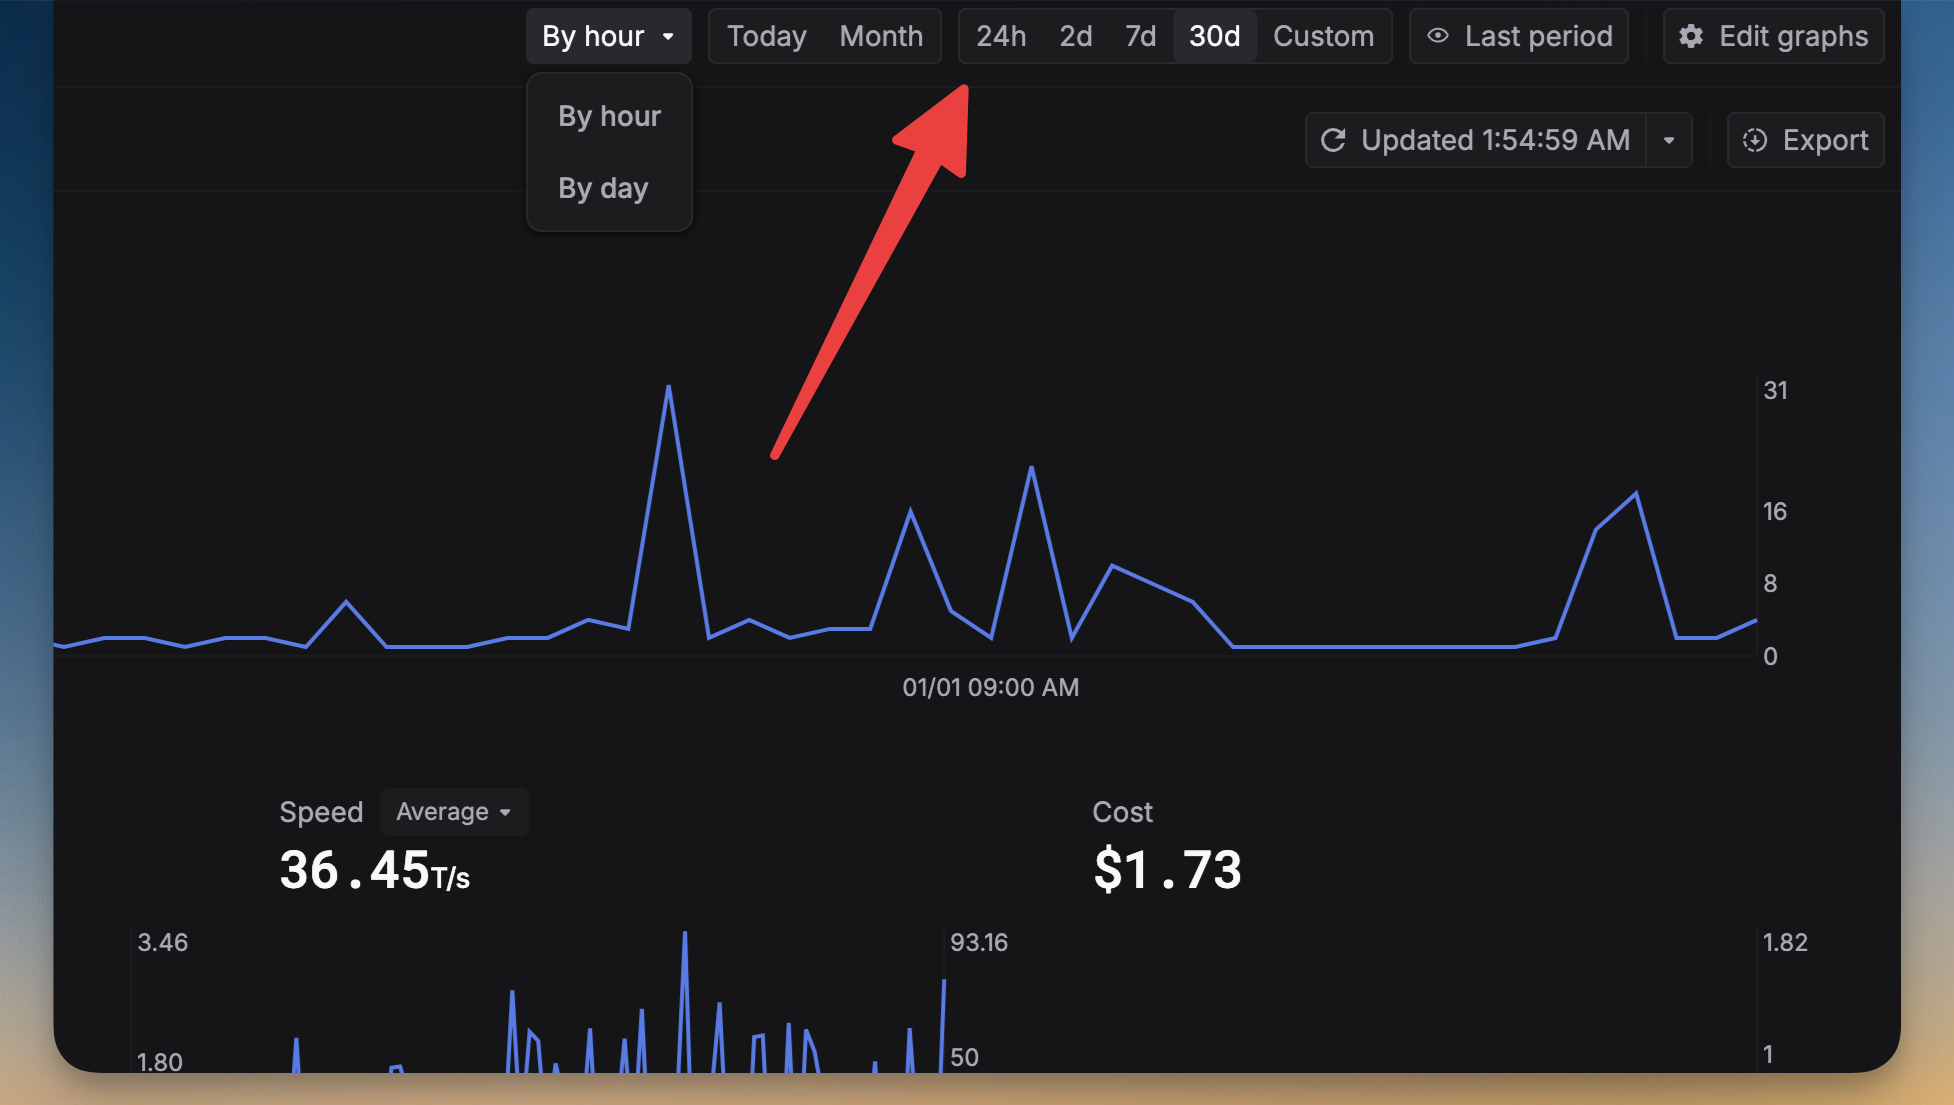
You can filter metrics on your dashboard by: Provider, Model, User, API key, and Time. This allows you to see the your LLM usage by different views. For example, you can see the usage by model, or by user, or by API key, or by time.

Filter options

To access filtering capabilities, click the Filter button located in the top-left corner of your dashboard.
Dashboard Filter Button

Configure filter settings

A modal window will appear with available filter options. Select your desired parameters to customize the dashboard view.
Dashboard Filter Options

Time-based filtering

Narrow down your metrics by selecting a specific time range. This allows you to focus on data from a particular period.
Dashboard Filter Time